


General Description
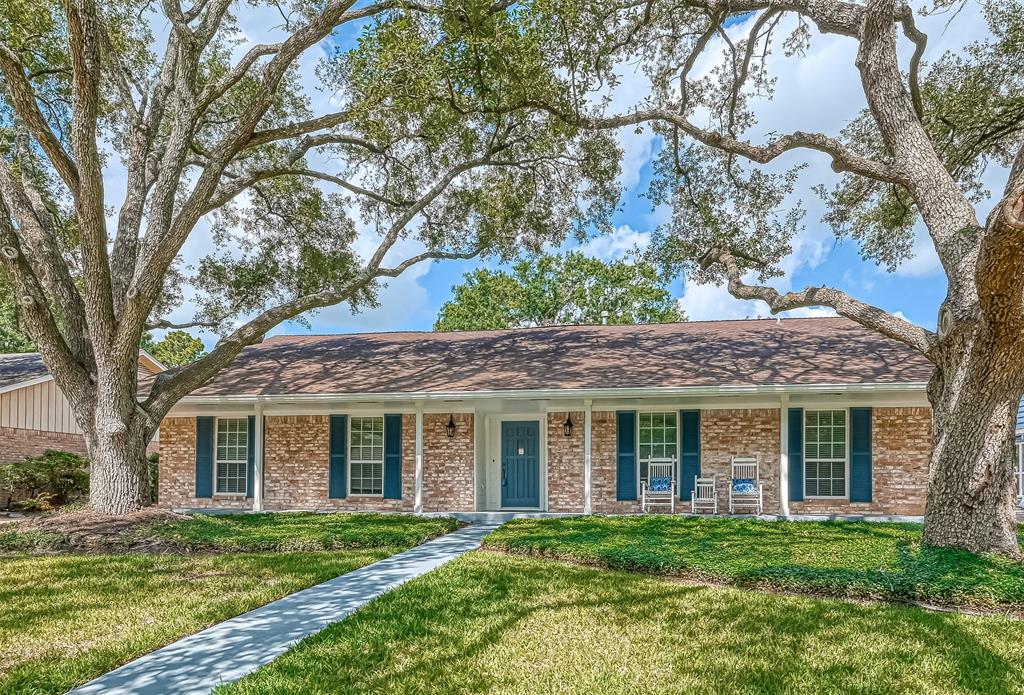
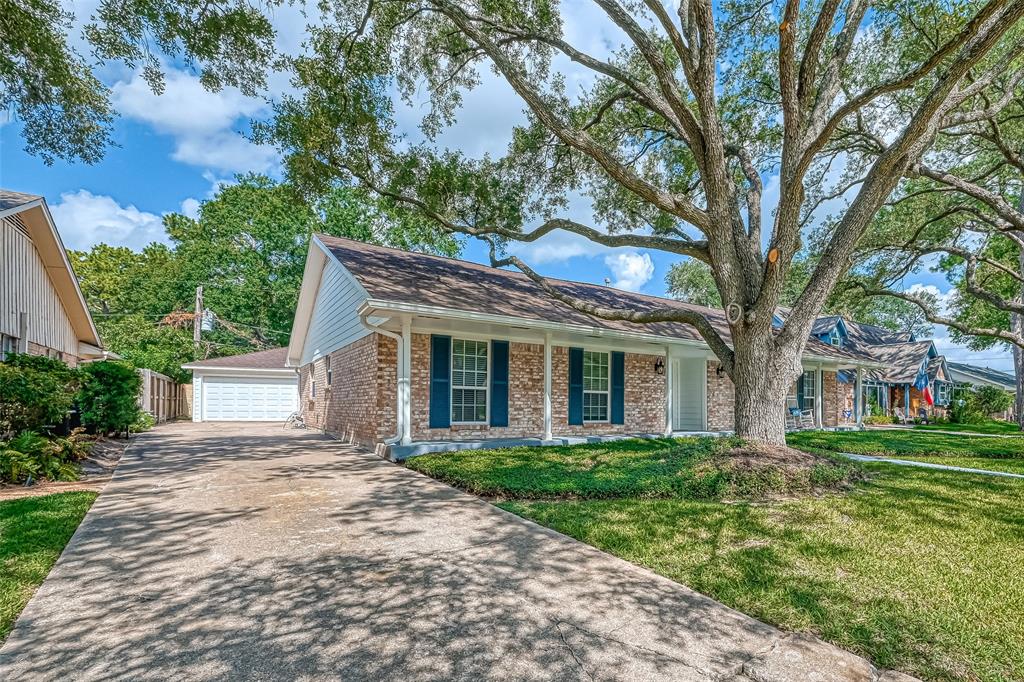
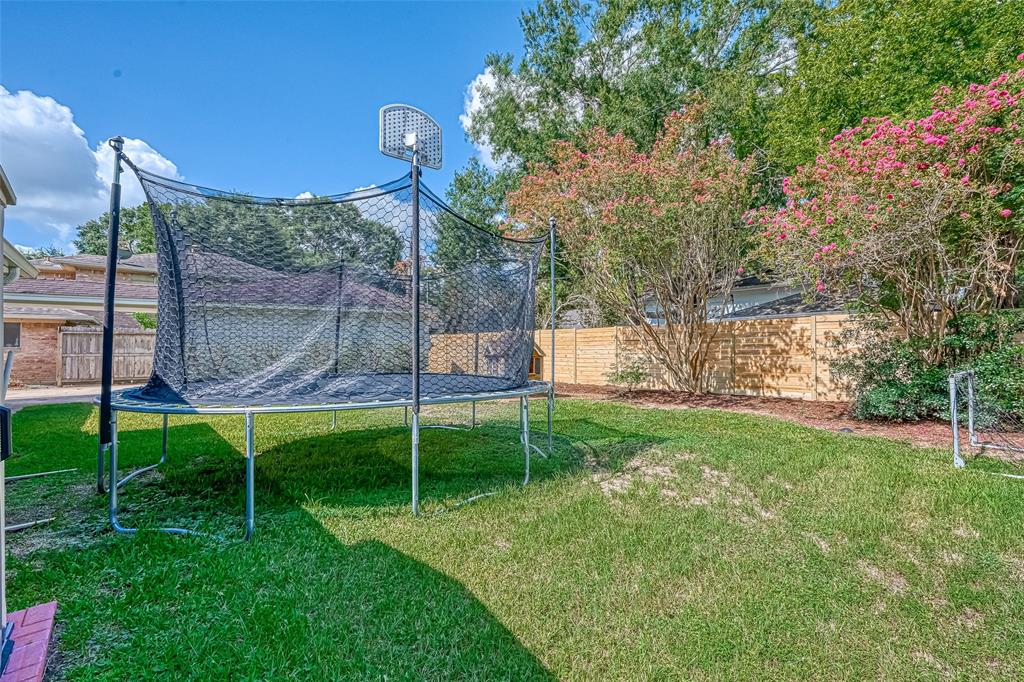
minimizeRemodeled one story home in the heart of Thornwood. This 4 bed 2 bath home features an abundance of natural light with great curb appeal and an open floor plan great for entertaining. Kitchen boasts granite counters, stainless steel appliances, travertine backsplash and plenty of built-in's. Primary suite highlights hardwood floors, walk in closet, remodeled bathroom with dual shower heads, and double vanity sinks with granite counters. The outside has a cover patio which is perfect to relax and enjoy your morning coffee. Recent upgrades include - A/C system replaced in 2019, engineered hardwood floors updated in 2020, new siding 2021, covered patio with new fence in backyard, large, detached 2 car garage with extra storage, and built on higher elevation - No flooding! Access to both neighborhood pools, quiet and safe cul-de-sac; close to dining and shopping and easy location for commuters. Zoned to Nottingham Elementary. Must see.
Rooms/Lot Dimensions
Interior Features
Exterior Features
Additional Information
Financial Information
Listing Broker:
Compass RE Texas, LLCProperty Tax
minimizeMarket Value Per Appraisal District
Cost/sqft based on Market Value
| Tax Year | Cost/sqft | Market Value | Change | Tax Assessment | Change |
|---|---|---|---|---|---|
| 2023 | $293.97 | $642,322 | 10.21% | $642,322 | 19.26% |
| 2022 | $266.73 | $582,814 | 15.20% | $538,585 | 10.00% |
| 2021 | $231.55 | $505,927 | 13.66% | $489,623 | 10.00% |
| 2020 | $203.71 | $445,112 | 0.00% | $445,112 | 0.00% |
| 2019 | $203.71 | $445,112 | -2.26% | $445,112 | -2.26% |
| 2018 | $208.42 | $455,392 | 0.00% | $455,392 | 4.24% |
| 2017 | $208.42 | $455,392 | 0.00% | $436,887 | 10.00% |
| 2016 | $208.42 | $455,392 | 16.41% | $397,170 | 10.00% |
| 2015 | $179.04 | $391,192 | 11.77% | $361,064 | 10.00% |
| 2014 | $160.18 | $350,000 | 17.29% | $328,240 | 10.00% |
| 2013 | $136.57 | $298,400 | -0.56% | $298,400 | -0.56% |
| 2012 | $137.33 | $300,074 | $300,074 |
2023 Harris County Appraisal District Tax Value
| Market Land Value: | $253,575 |
| Market Improvement Value: | $388,747 |
| Total Market Value: | $642,322 |
2023 Tax Rates
| SPRING BRANCH ISD: | 1.2688 % |
| HARRIS COUNTY: | 0.3437 % |
| HC FLOOD CONTROL DIST: | 0.0306 % |
| PORT OF HOUSTON AUTHORITY: | 0.0080 % |
| HC HOSPITAL DIST: | 0.1483 % |
| HC DEPARTMENT OF EDUCATION: | 0.0049 % |
| HOUSTON CITY OF: | 0.5336 % |
| Total Tax Rate: | 2.3379 % |
Estimated Mortgage/Tax
minimize| Estimated Monthly Principal & Interest (Based on the calculation below) | $ 2,288 |
| Estimated Monthly Property Tax (Based on Tax Assessment 2023) | $ 1,251 |
| Home Owners Insurance | Get a Quote |
Subdivision Facts
minimize2023 Subdivision Facts
Schools
minimizeSchool information is computer generated and may not be accurate or current. Buyer must independently verify and confirm enrollment. Please contact the school district to determine the schools to which this property is zoned.
ASSIGNED SCHOOLS
View Nearby Schools ↓
Property Map
minimize823 Pinesap Drive Houston TX 77079 was recently sold. It is a 0.20 Acre(s) Lot, 2,185 SQFT, 4 Beds, 2 Full Bath(s) in Thornwood.
View all homes on Pinesap

items