


General Description
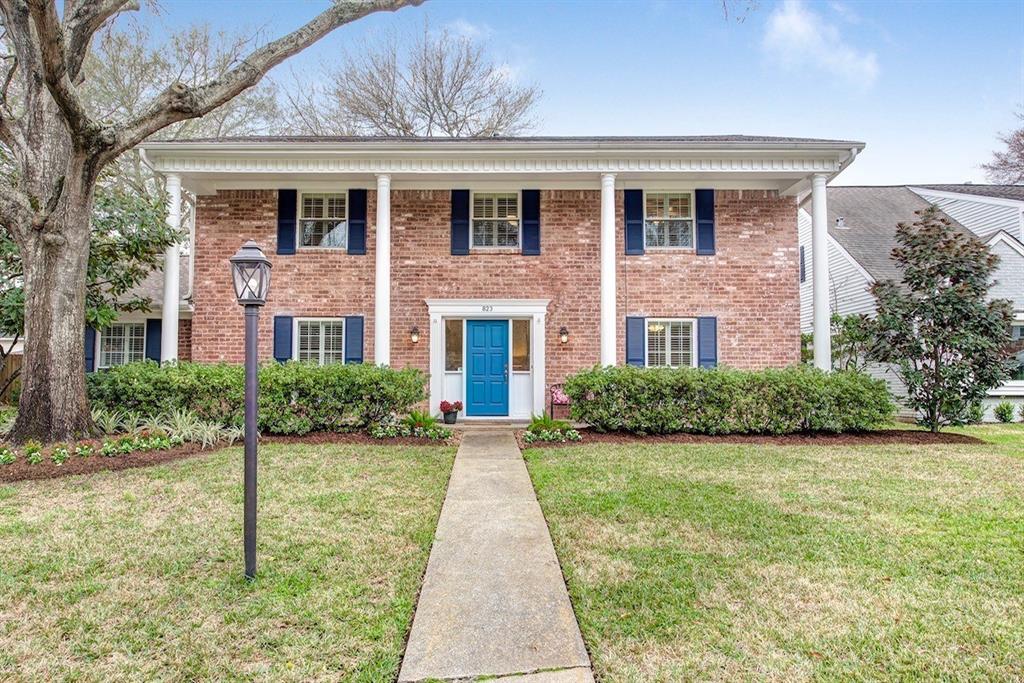
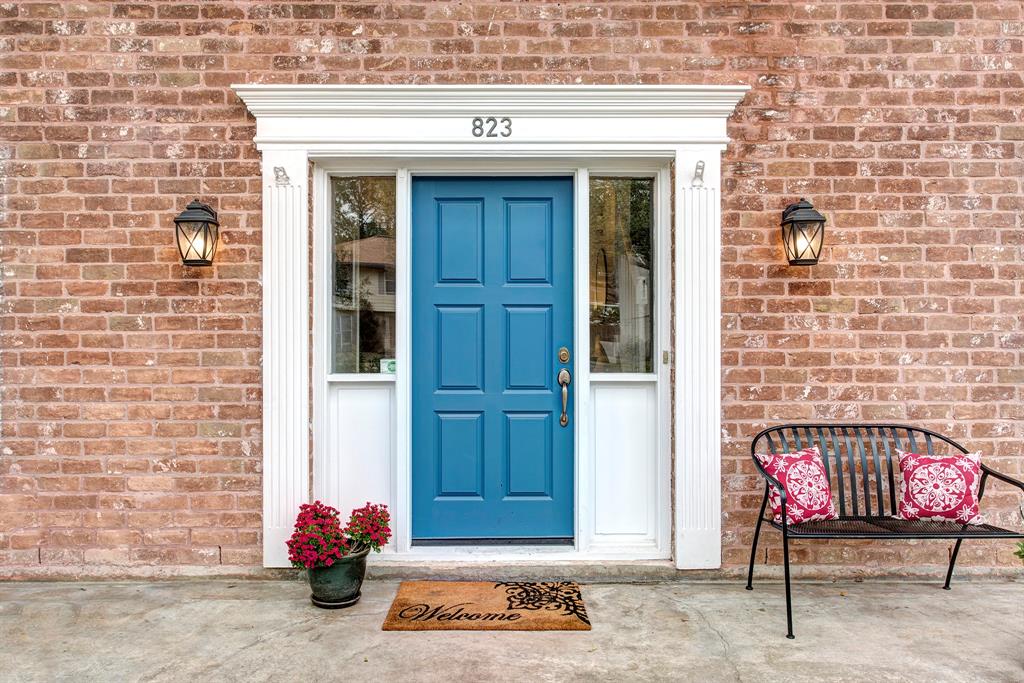
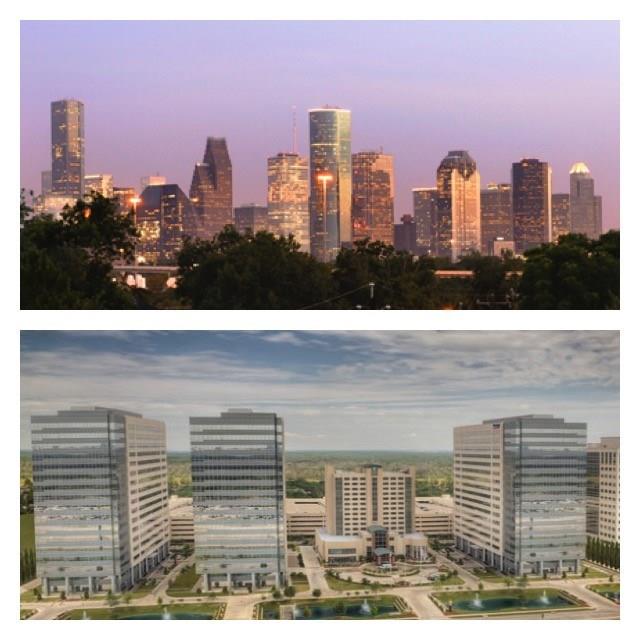
minimizeLocated on a quiet cul-de-sac in the Thornwood subdivision sits 823 Thornwick, a picture-perfect 2-story colonial featuring 5 bedrooms/2.5 baths. Master Down! PROPERTY AND IMPROVEMENTS DID NOT FLOOD FROM HARVEY *per seller. 1st floor open floorplan offers multiple living areas, cook’s kitchen, formal dining, breakfast area and amazing views to the backyard. Downstairs master includes sitting area, walk-in closet, hallway closet and charming granite bathroom. 4 large secondary bedrooms up + hallway bath with granite counters, double sinks and shower/tub. Spectacular backyard with patio, greenspace, play area, lush landscaping and sprinkler system. Covered walkway from the laundry room to the 2 car garage with extra storage space. Energy efficient windows, hi-seer HVAC system and backyard drainage. Close to Thornwood subdivision community pool and zoned to excellent Spring Branch schools. Convenient location to the Energy Corridor, City Center and area restaurants, shops & parks.
Rooms/Lot Dimensions
Interior Features
Exterior Features
Additional Information
Financial Information
Selling Agent and Brokerage
minimize

Property Tax
minimizeMarket Value Per Appraisal District
Cost/sqft based on Market Value
| Tax Year | Cost/sqft | Market Value | Change | Tax Assessment | Change |
|---|---|---|---|---|---|
| 2023 | $258.19 | $725,000 | 16.17% | $611,050 | 10.00% |
| 2022 | $222.26 | $624,096 | 23.58% | $555,500 | 10.00% |
| 2021 | $179.84 | $505,000 | 0.00% | $505,000 | 0.00% |
| 2020 | $179.84 | $505,000 | -5.95% | $505,000 | -1.27% |
| 2019 | $191.22 | $536,944 | 15.47% | $511,500 | 10.00% |
| 2018 | $165.60 | $465,000 | 0.00% | $465,000 | 10.99% |
| 2017 | $165.60 | $465,000 | 6.65% | $418,972 | 10.00% |
| 2016 | $155.27 | $435,995 | -4.89% | $380,884 | 10.00% |
| 2015 | $163.25 | $458,400 | 6.48% | $346,259 | 10.00% |
| 2014 | $153.31 | $430,494 | 50.44% | $314,781 | 10.00% |
| 2013 | $101.91 | $286,165 | -7.42% | $286,165 | -7.42% |
| 2012 | $110.08 | $309,113 | $309,113 |
2023 Harris County Appraisal District Tax Value
| Market Land Value: | $248,400 |
| Market Improvement Value: | $476,600 |
| Total Market Value: | $725,000 |
2023 Tax Rates
| SPRING BRANCH ISD: | 1.2688 % |
| HARRIS COUNTY: | 0.3437 % |
| HC FLOOD CONTROL DIST: | 0.0306 % |
| PORT OF HOUSTON AUTHORITY: | 0.0080 % |
| HC HOSPITAL DIST: | 0.1483 % |
| HC DEPARTMENT OF EDUCATION: | 0.0049 % |
| HOUSTON CITY OF: | 0.5336 % |
| Total Tax Rate: | 2.3379 % |
Estimated Mortgage/Tax
minimize| Estimated Monthly Principal & Interest (Based on the calculation below) | $ 1,910 |
| Estimated Monthly Property Tax (Based on Tax Assessment 2023) | $ 1,190 |
| Home Owners Insurance | Get a Quote |
Subdivision Facts
minimize2023 Subdivision Facts
Schools
minimizeSchool information is computer generated and may not be accurate or current. Buyer must independently verify and confirm enrollment. Please contact the school district to determine the schools to which this property is zoned.
ASSIGNED SCHOOLS
View Nearby Schools ↓
Property Map
minimize823 Thornwick Drive Houston TX 77079 was recently sold. It is a 0.19 Acre(s) Lot, 2,808 SQFT, 5 Beds, 2 Full Bath(s) & 1 Half Bath(s) in Thornwood Sec 01.
View all homes on Thornwick

items