


General Description
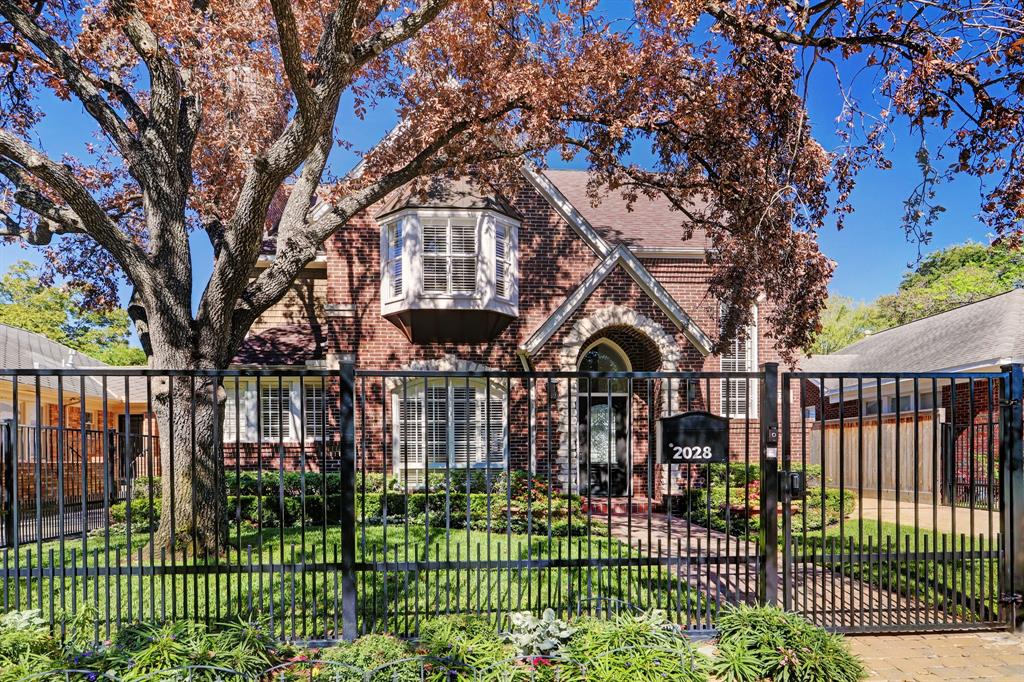
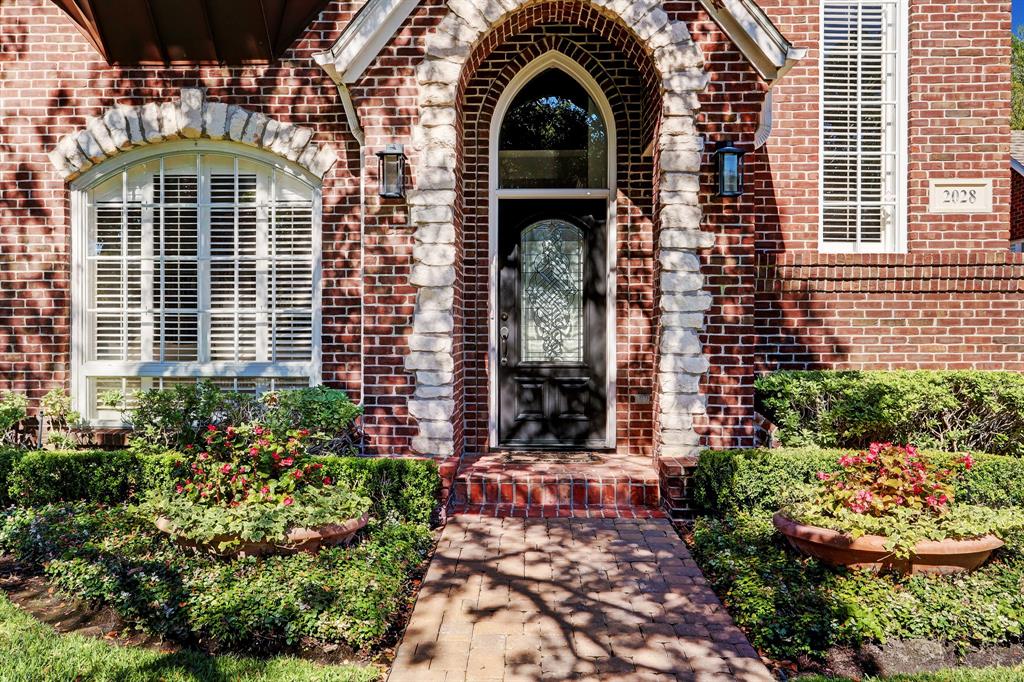
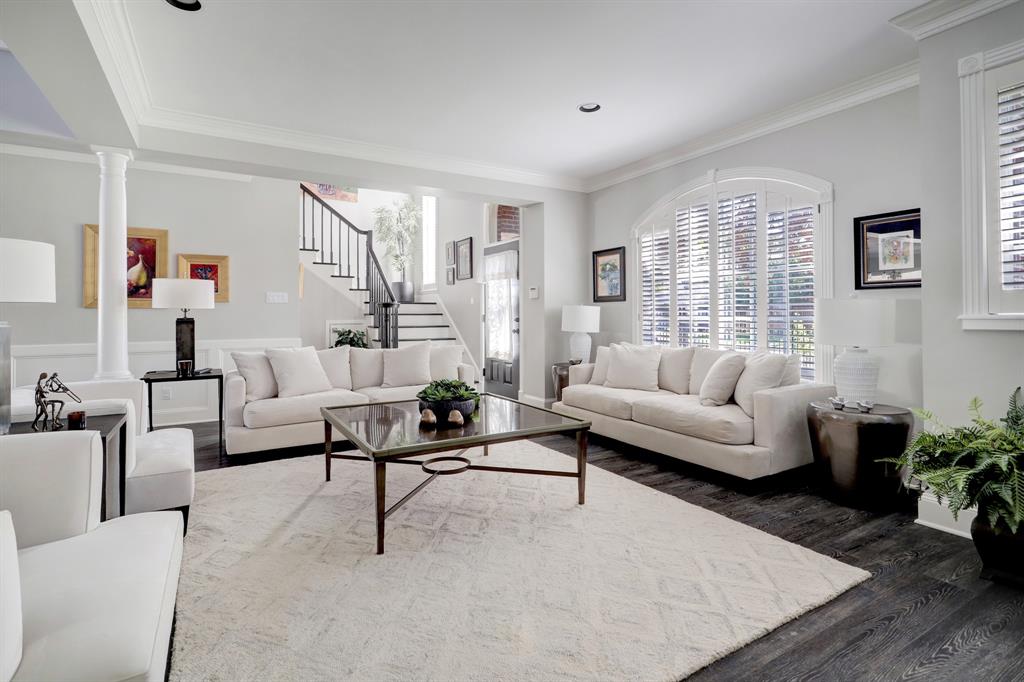
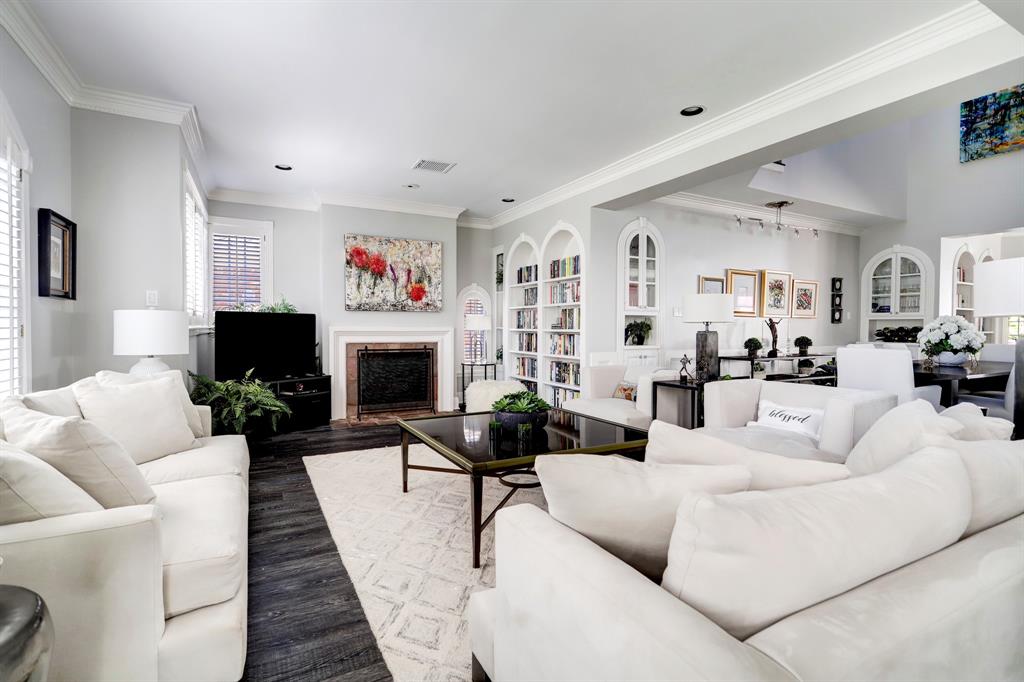
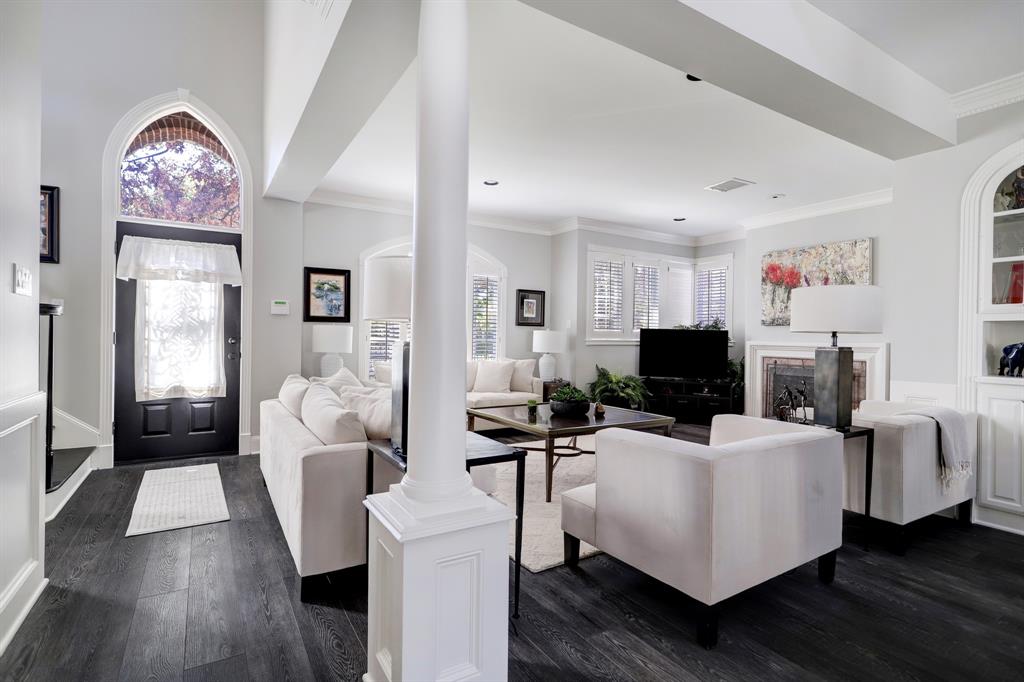
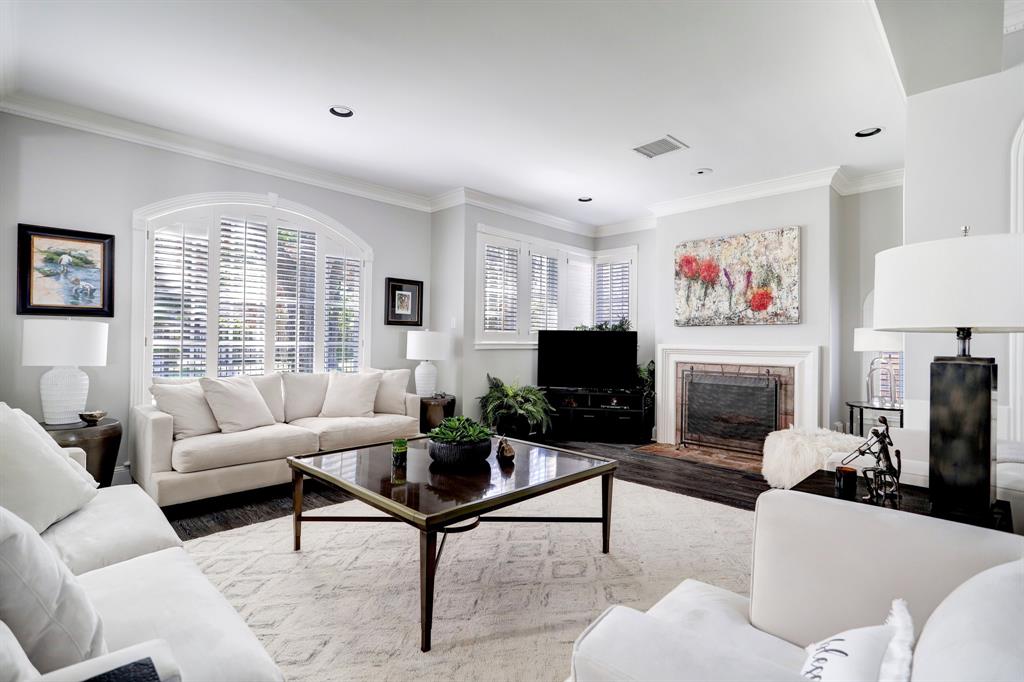
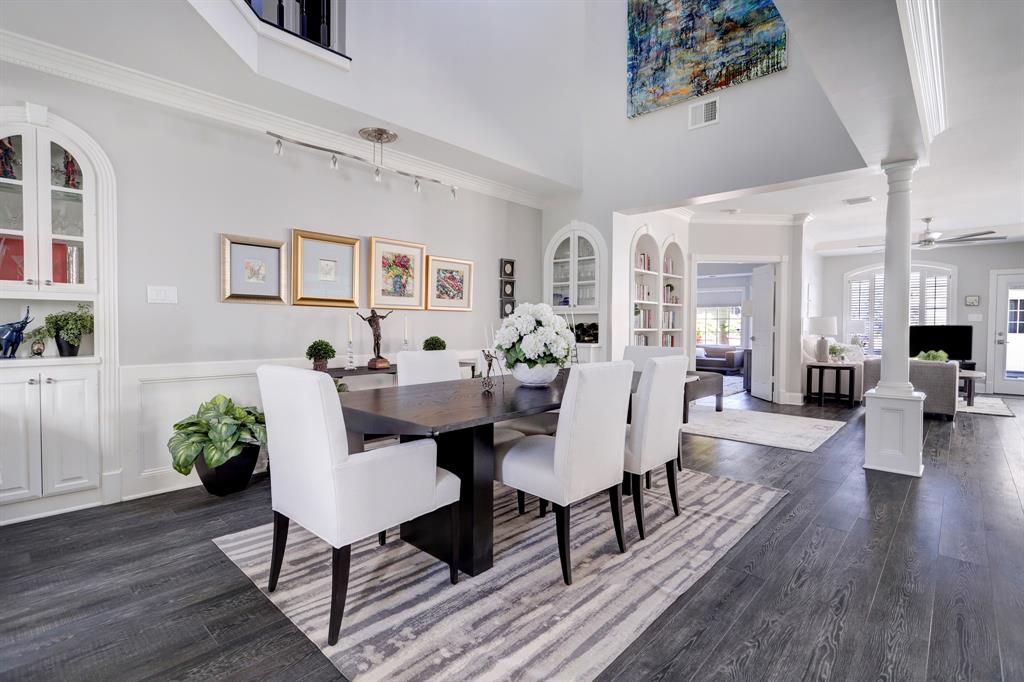
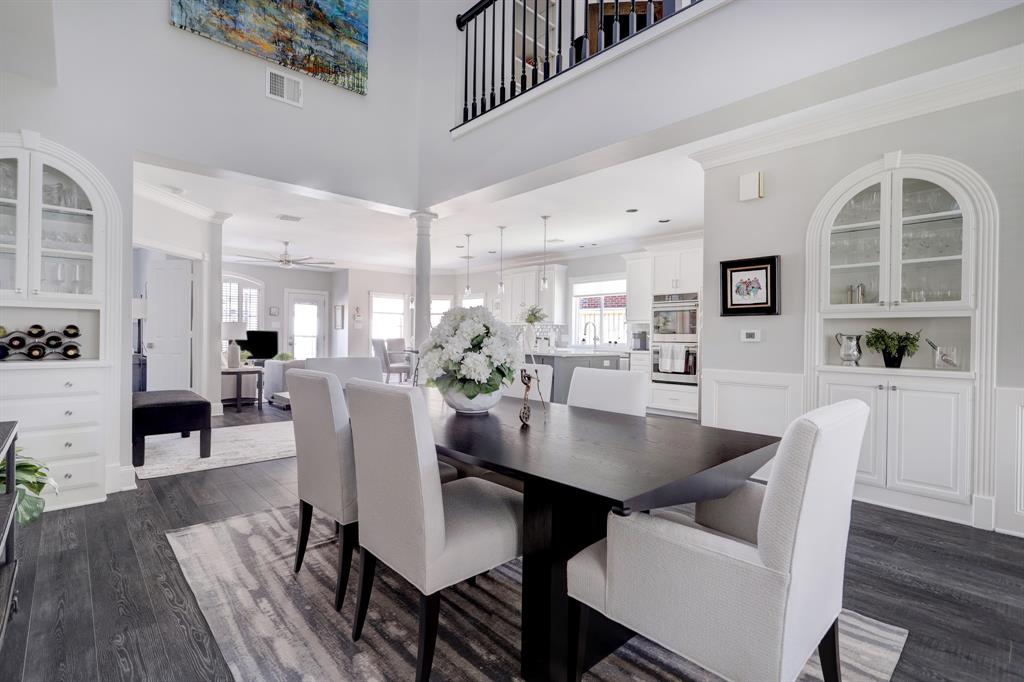
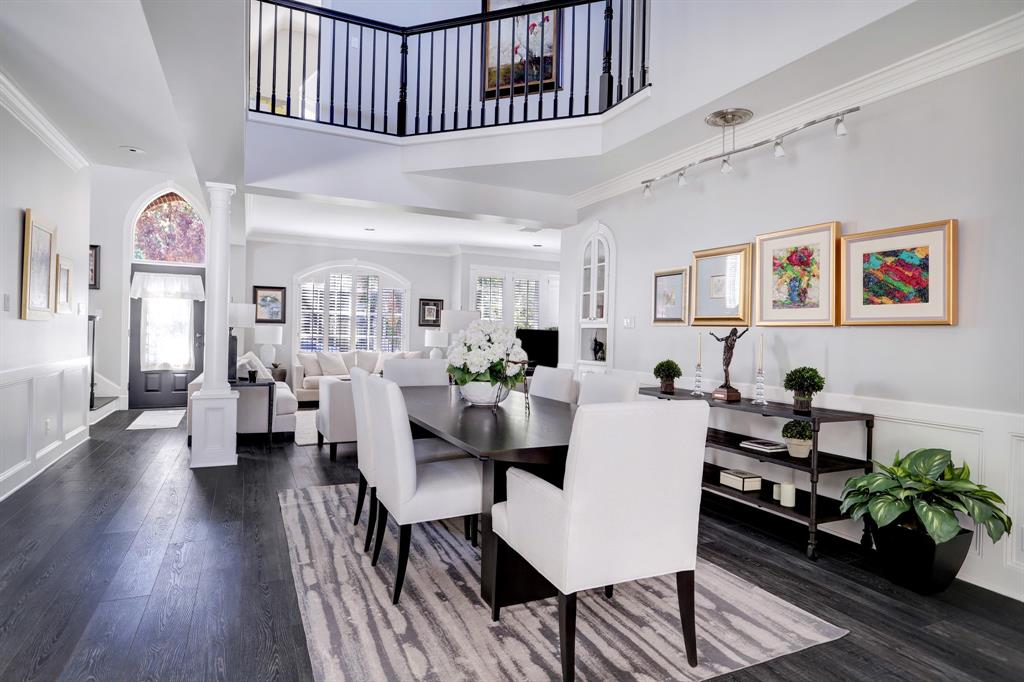
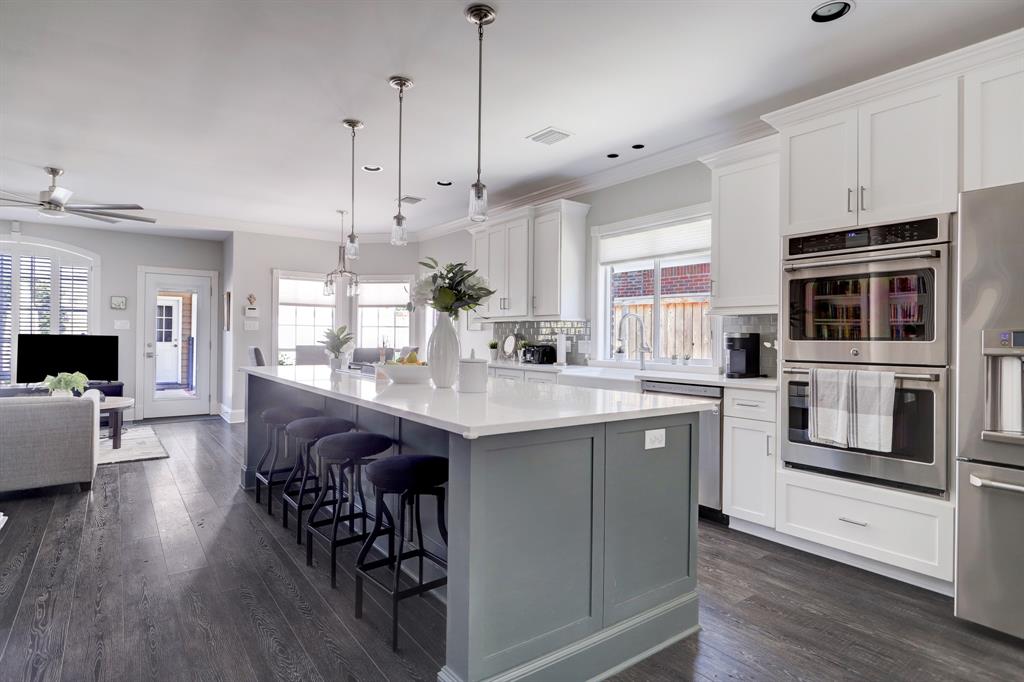
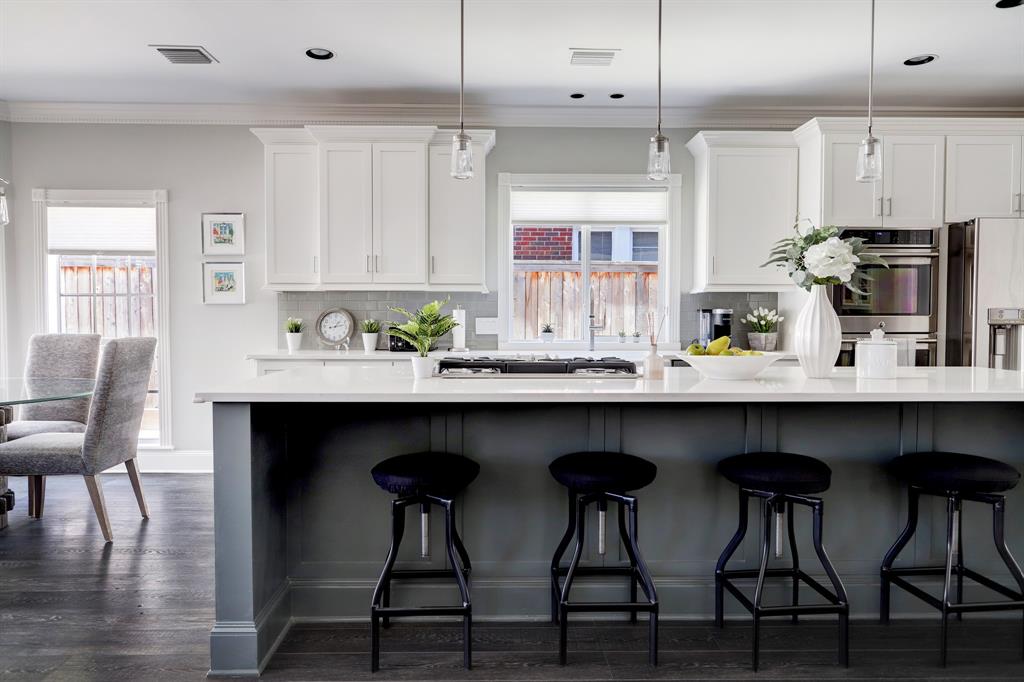
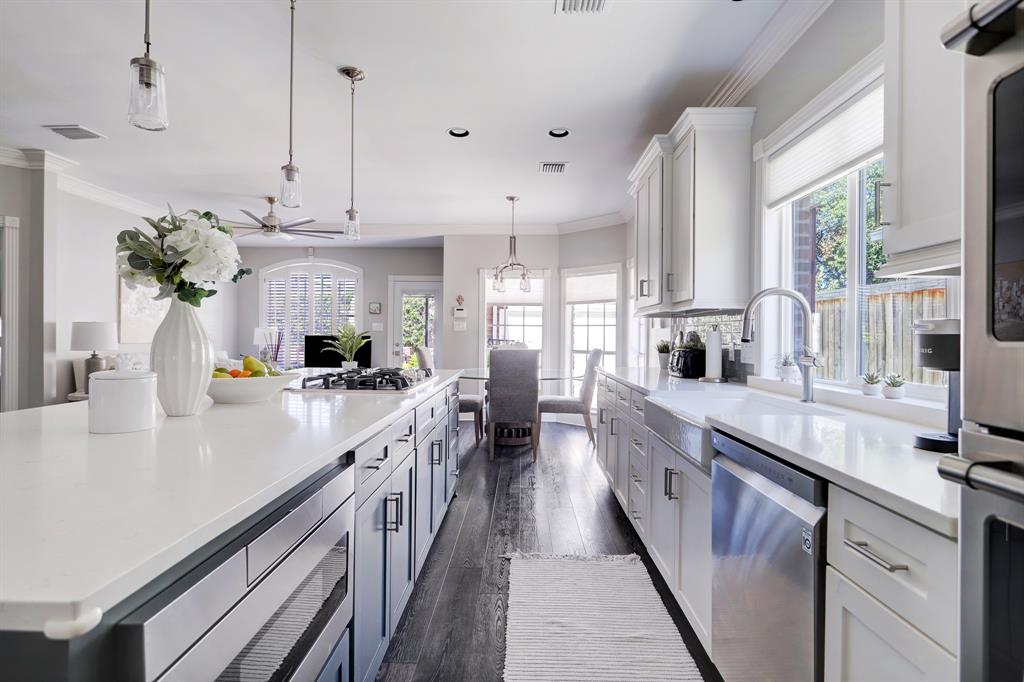
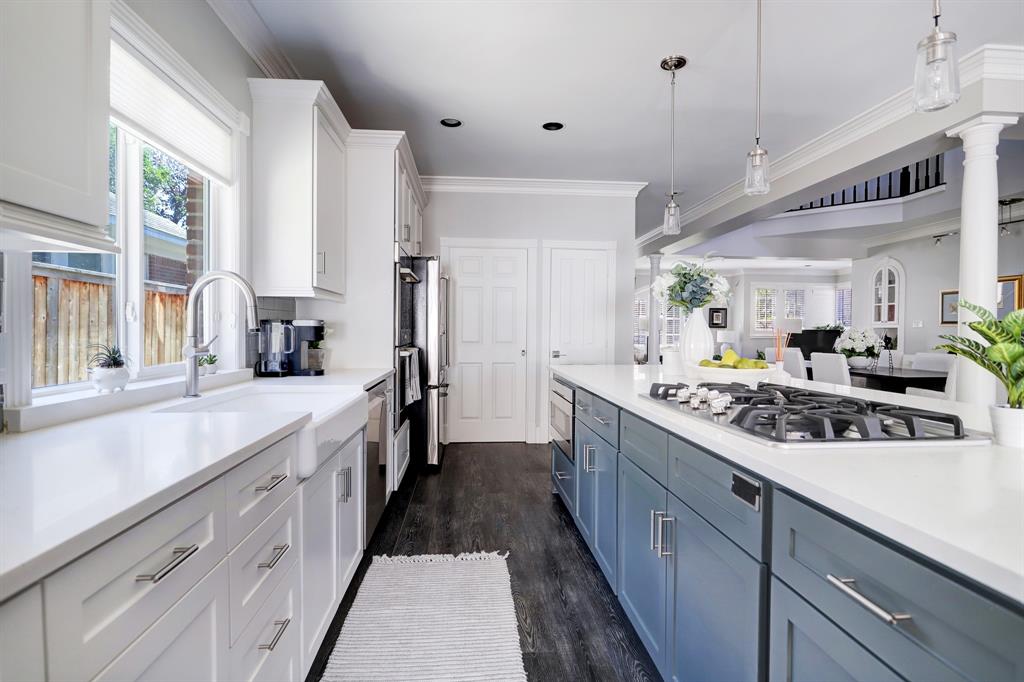
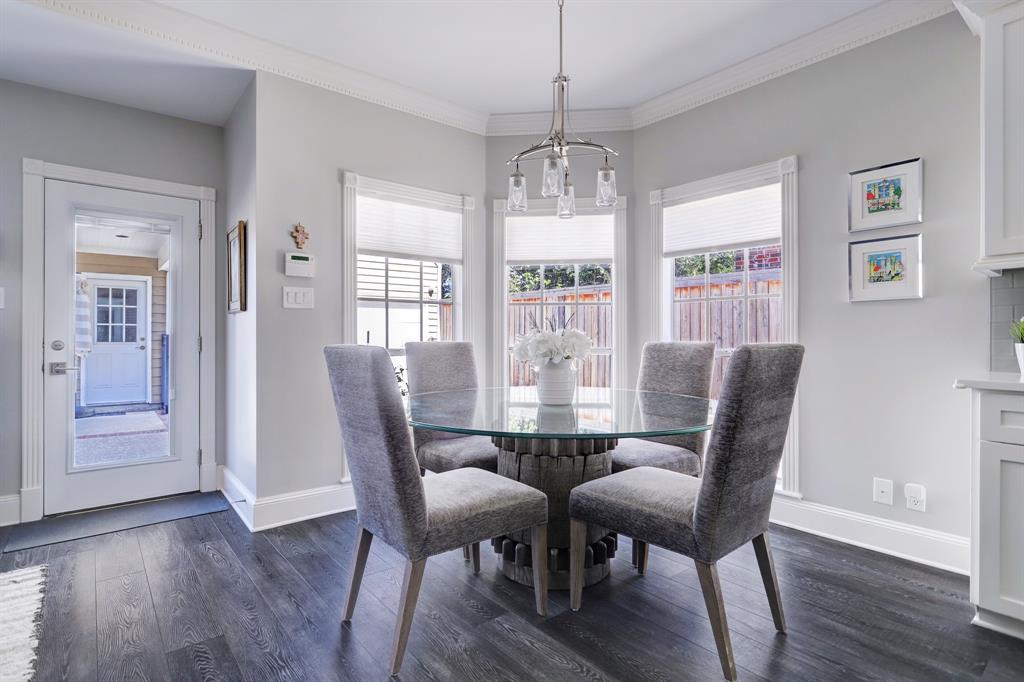
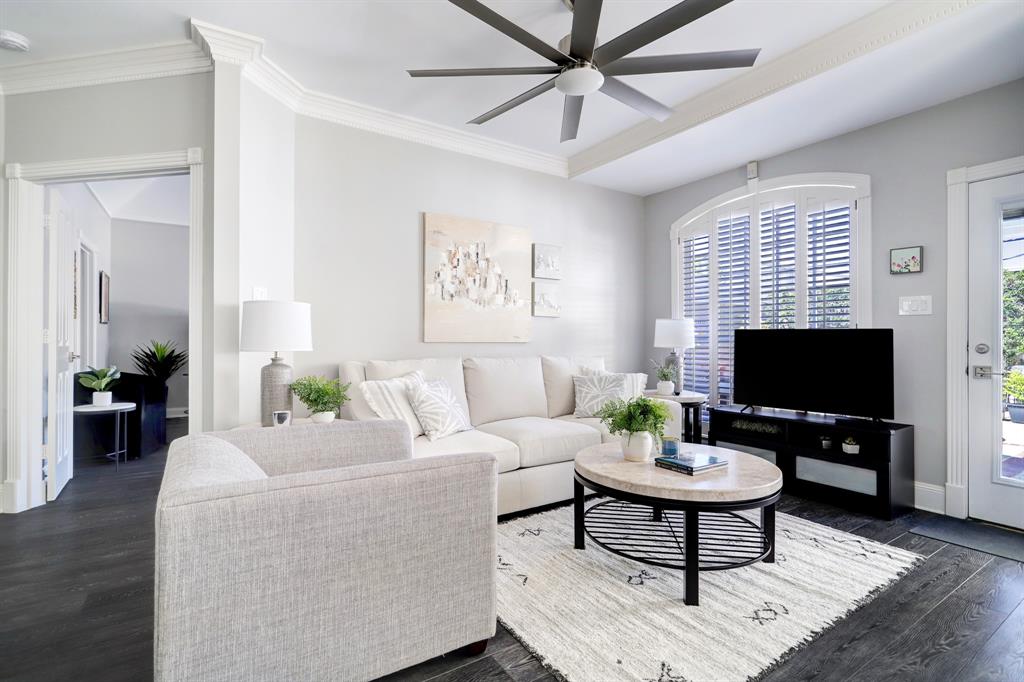
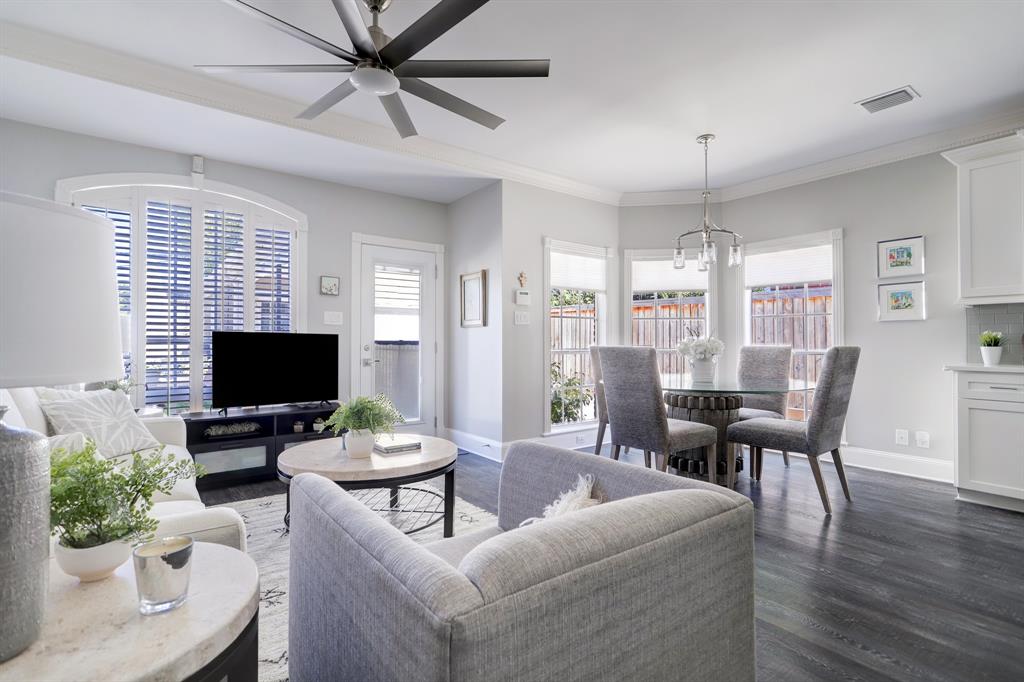
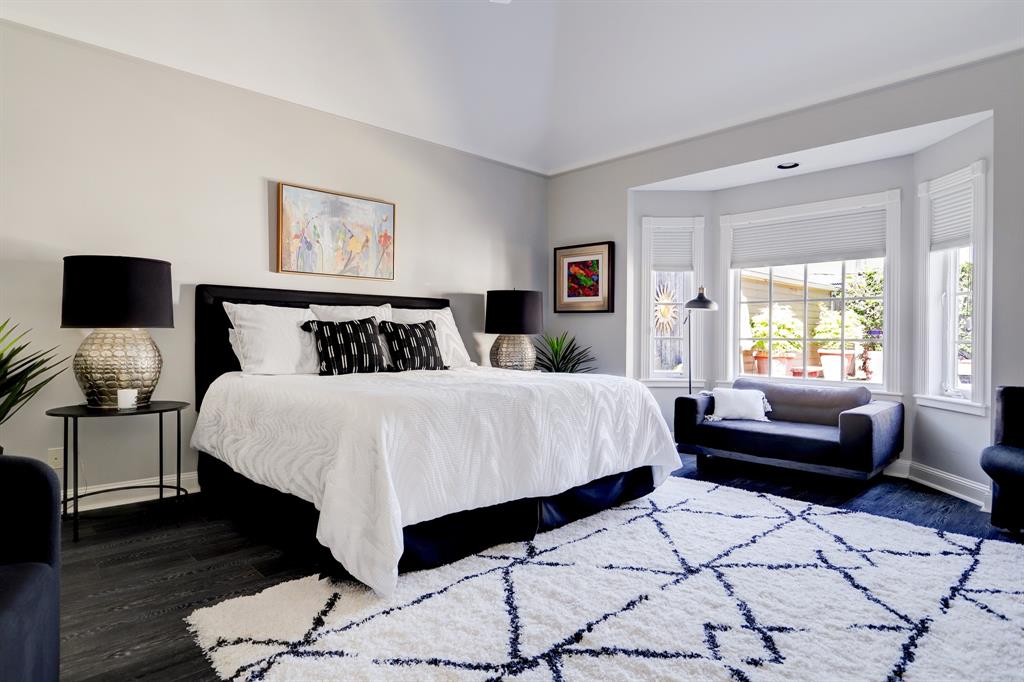
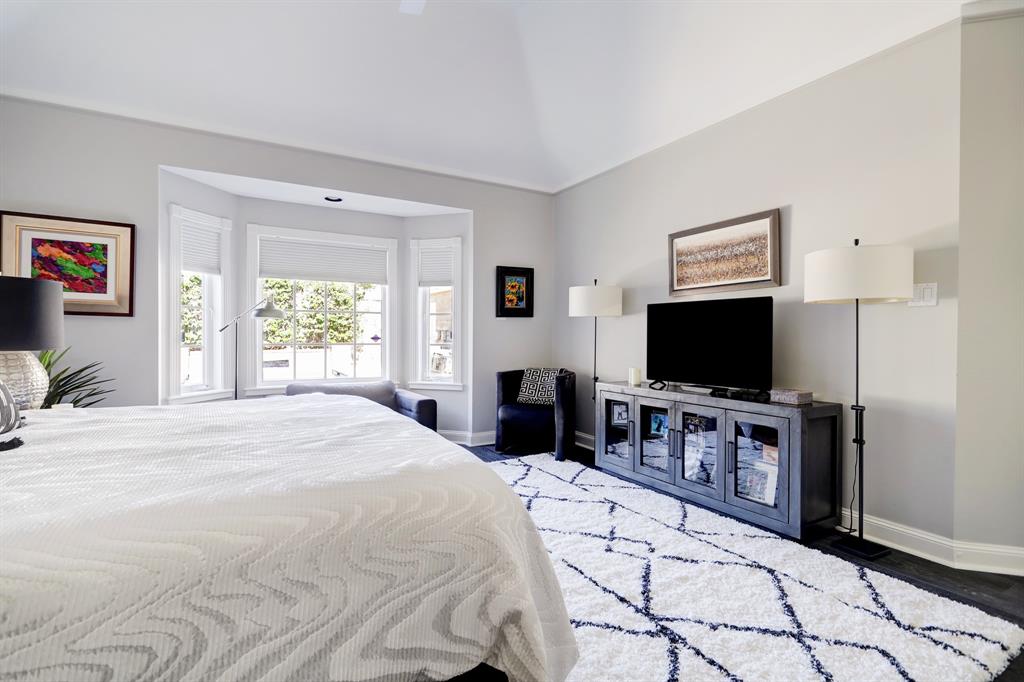
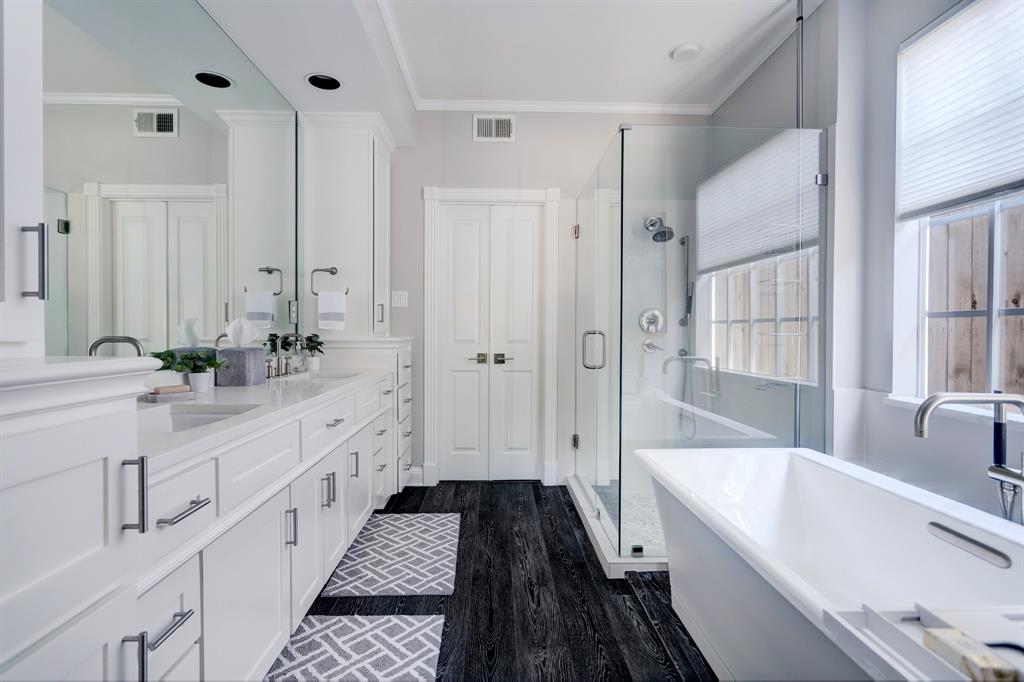
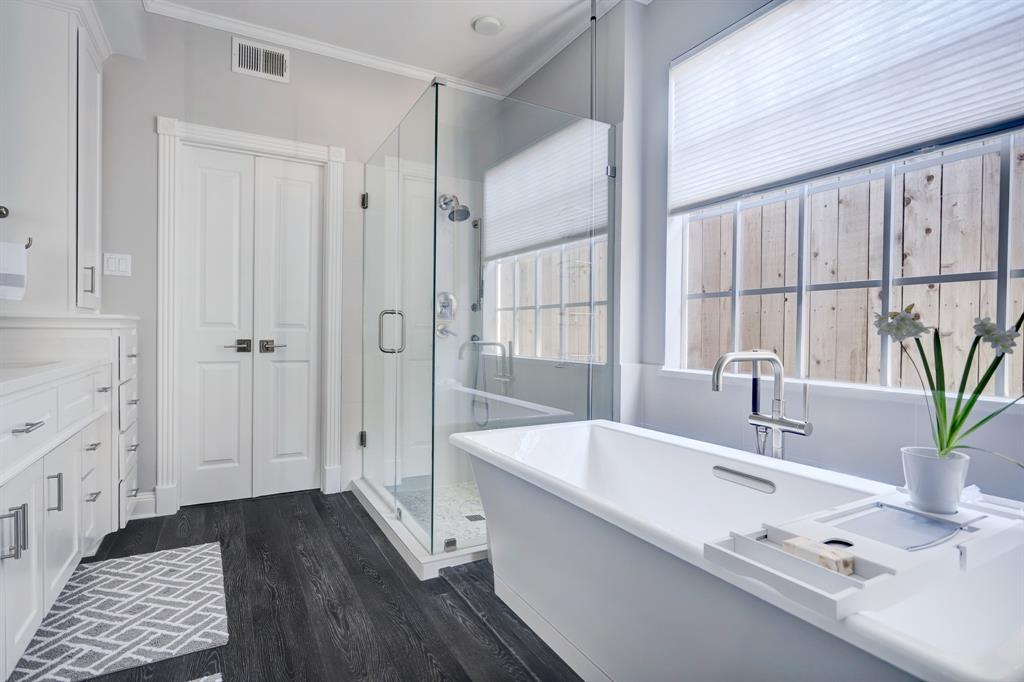
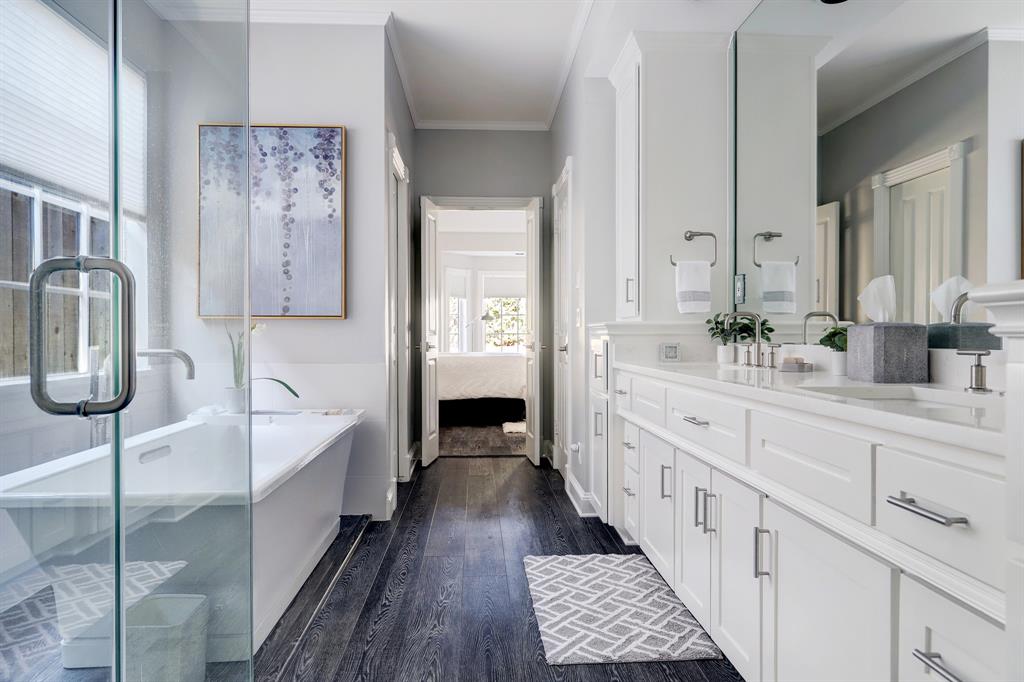
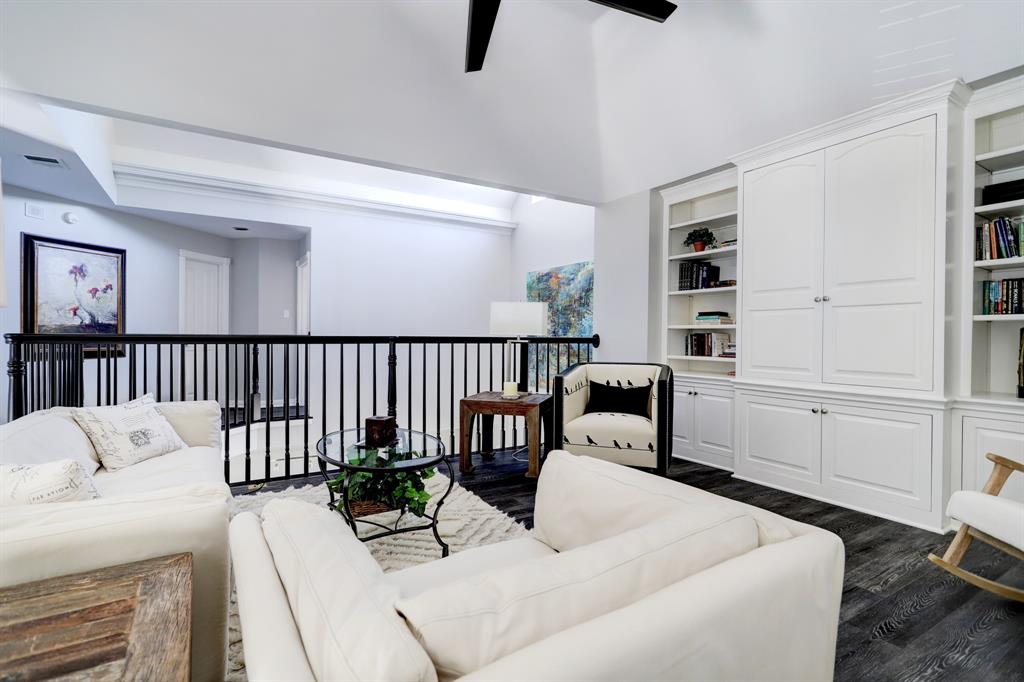
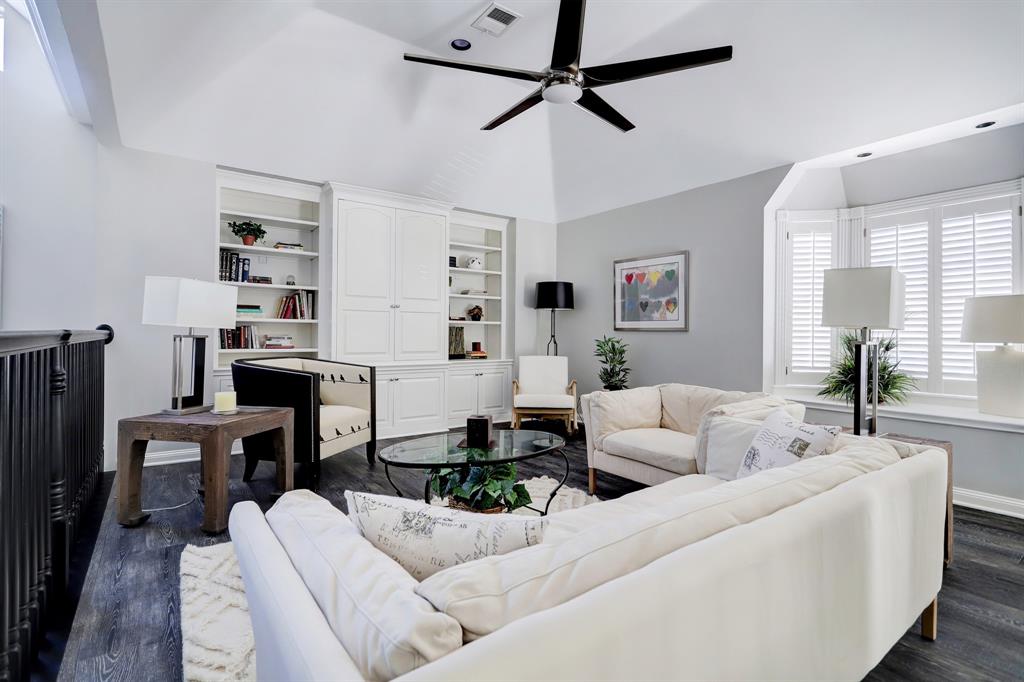
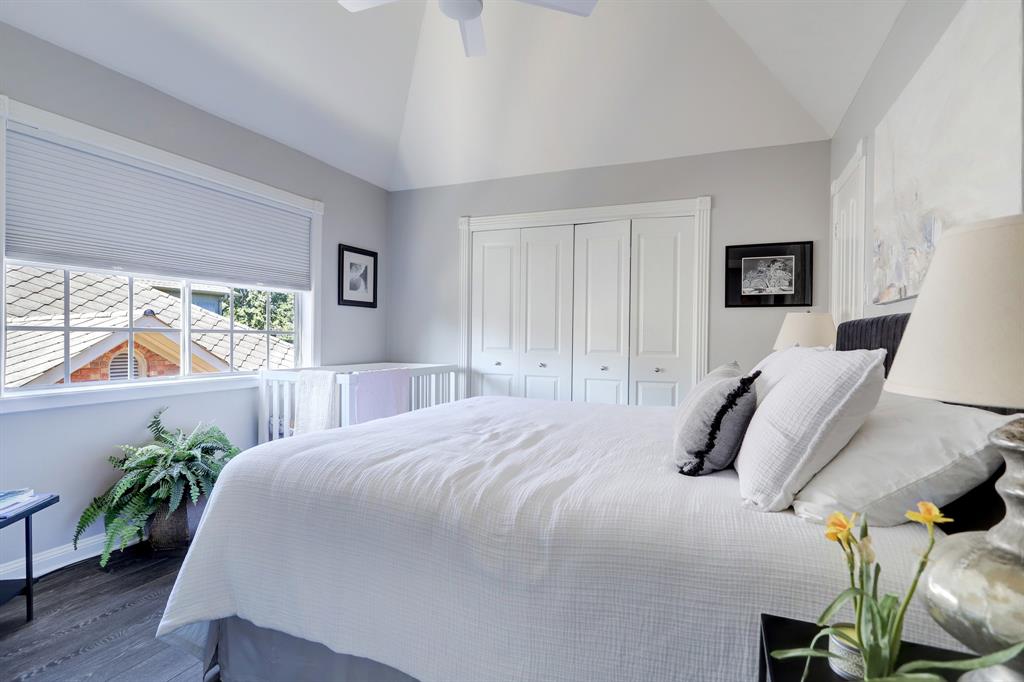
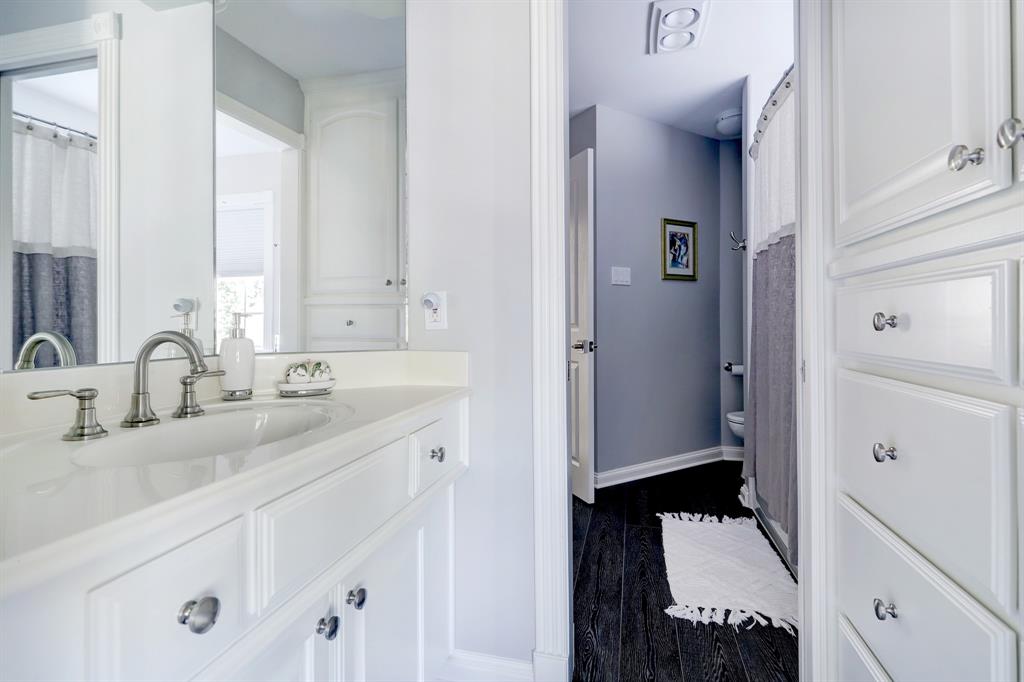
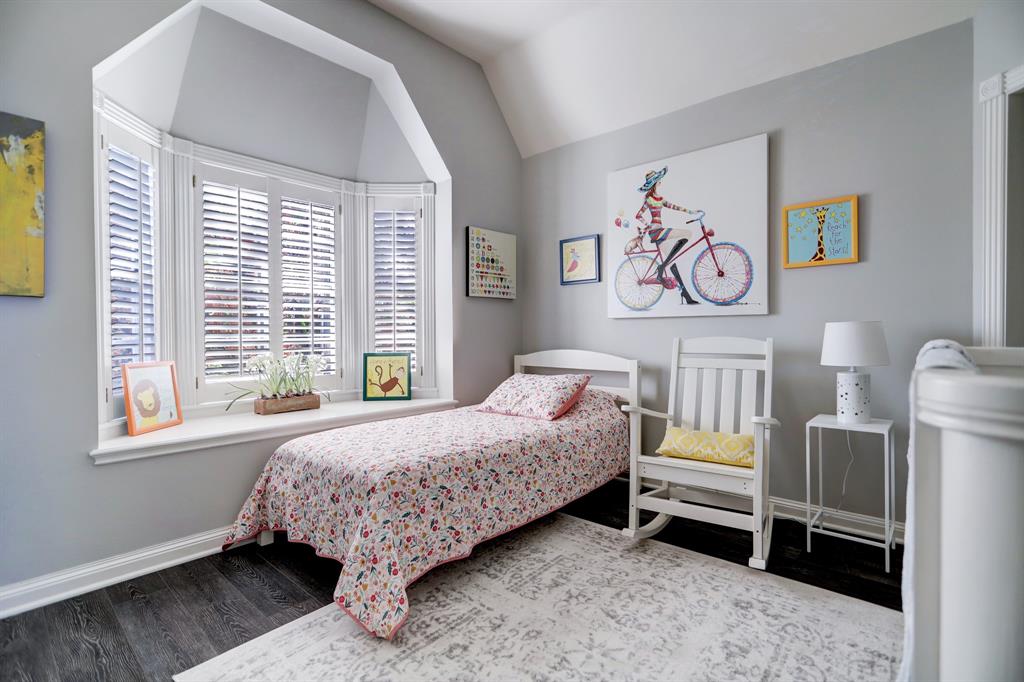
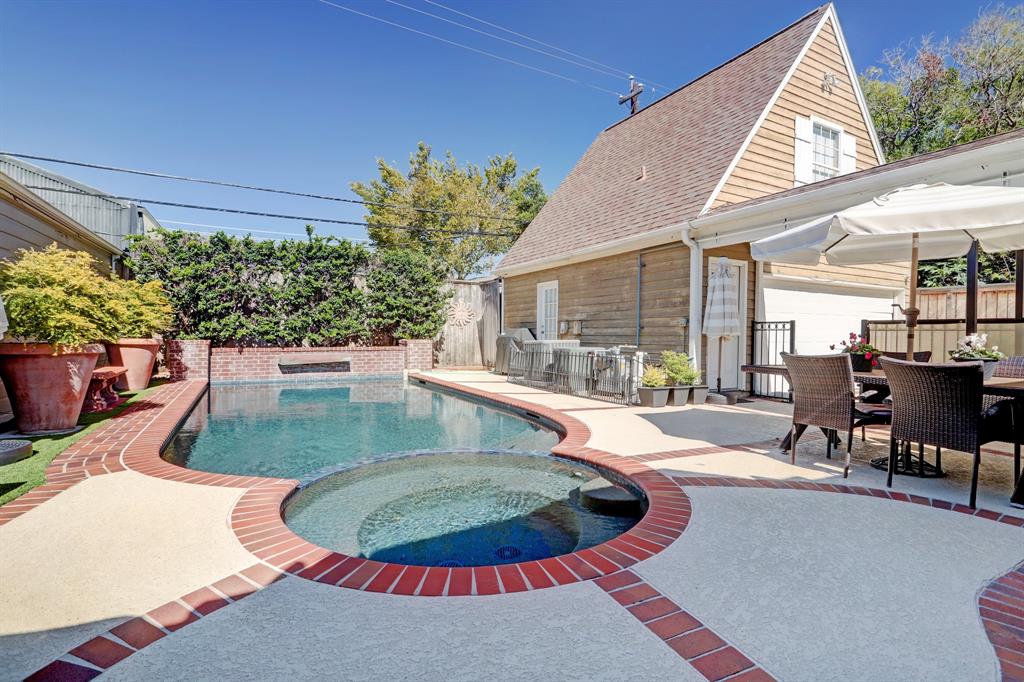
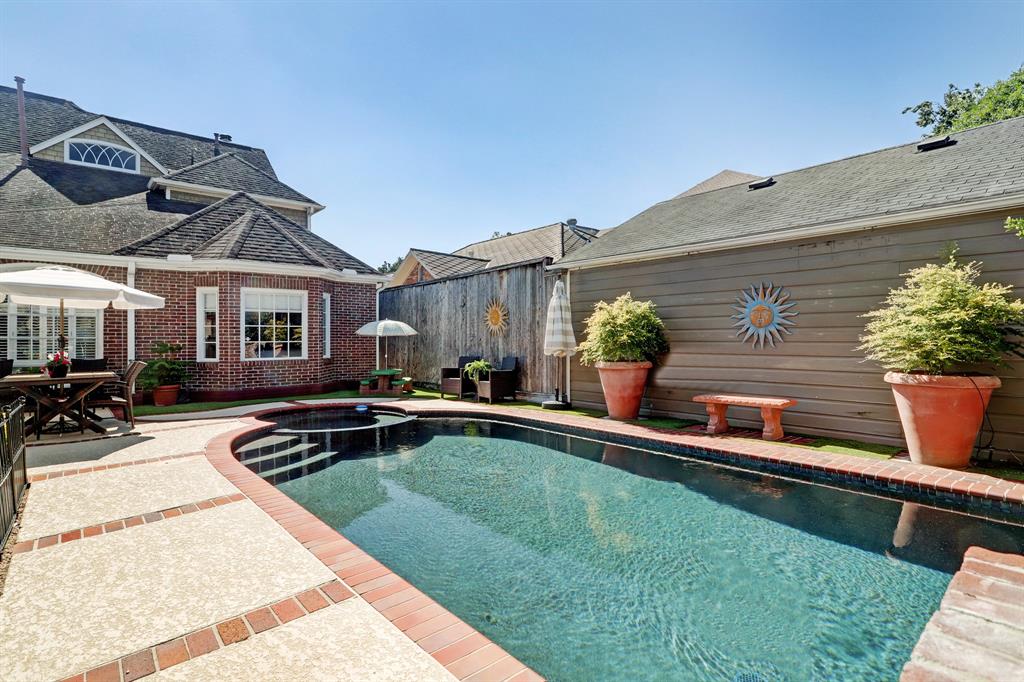
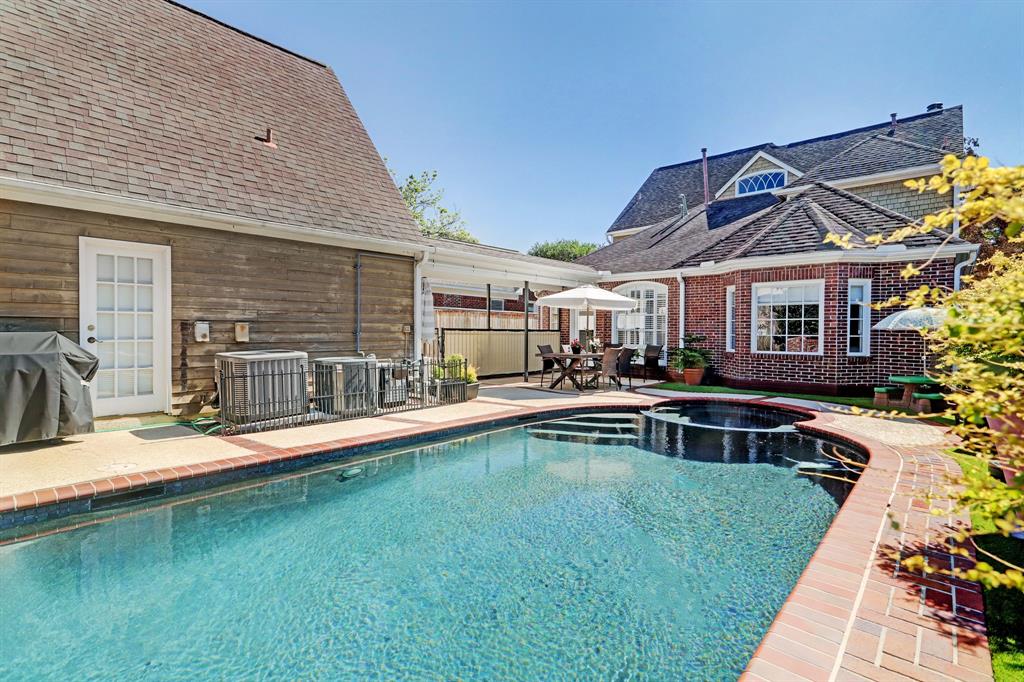
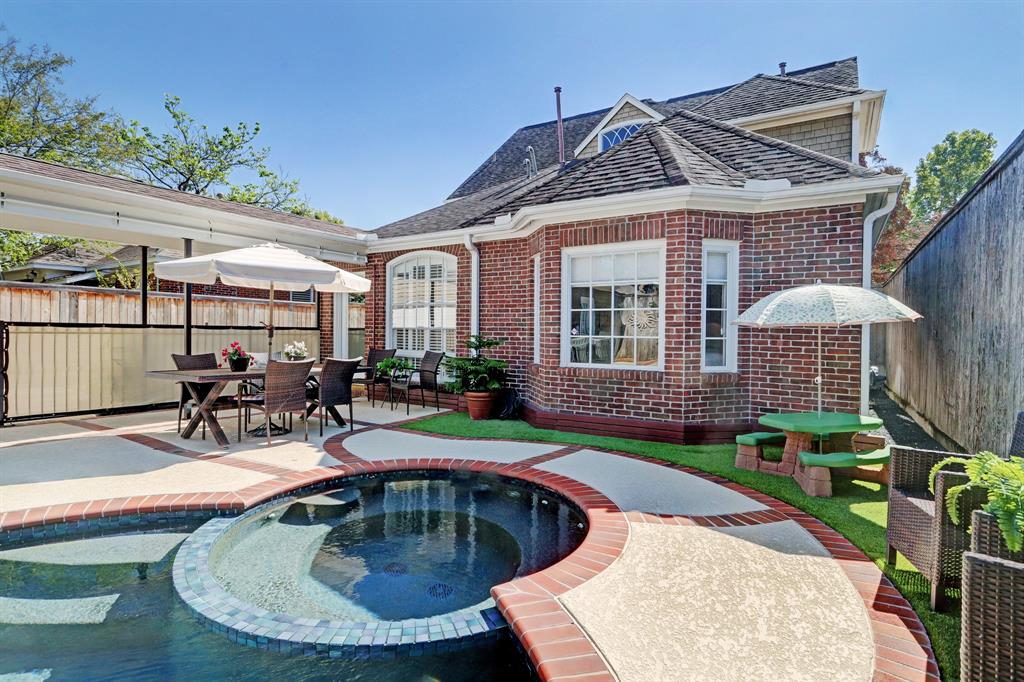
minimizeGorgeous Upper Kirby residence offers a perfect blend of contemporary updates and timeless charm. With three bedrooms, two and a half bathrooms, and a flex space over the garage, this home provides ample space to live and entertain. Updated in 2017, the home is open and bright with dual living spaces on the first floor, an island kitchen with quartz countertops and stainless appliances, adjacent dining area and views of the backyard and pool. The primary suite is located on the first floor with spa bath. Two additional bedrooms are located on the second floor joined by a Hollywood bath. Large den on the second floor with built-ins. The fully fenced property (2022) features a driveway and pedestrian gate for added convenience. Additional updates include: new HVAC and ductwork (2019 and 2023), tankless water heater (2023), and a whole house generator (2022). Take advantage of the vibrant Montrose neighborhood, with its diverse dining, shopping, and entertainment options.
Rooms/Lot Dimensions
Interior Features
Exterior Features
Additional Information
Financial Information
Selling Agent and Brokerage
minimize
Phyllis Foster Real Estate Services
2600 South Shore Blvd League
League City, TX 77573
Property Tax
minimizeMarket Value Per Appraisal District
Cost/sqft based on Market Value
| Tax Year | Cost/sqft | Market Value | Change | Tax Assessment | Change |
|---|---|---|---|---|---|
| 2023 | $344.46 | $990,314 | 18.86% | $916,526 | 10.00% |
| 2022 | $289.81 | $833,206 | -3.55% | $833,206 | -3.55% |
| 2021 | $300.48 | $863,874 | 0.00% | $863,874 | 0.00% |
| 2020 | $300.48 | $863,874 | 0.00% | $863,874 | 0.00% |
| 2019 | $300.48 | $863,874 | 1.45% | $863,874 | 1.45% |
| 2018 | $296.18 | $851,519 | 0.00% | $851,519 | 7.82% |
| 2017 | $296.18 | $851,519 | 4.08% | $789,727 | 10.00% |
| 2016 | $284.56 | $818,100 | 16.87% | $717,934 | 10.00% |
| 2015 | $243.48 | $700,000 | 1.79% | $652,668 | 10.00% |
| 2014 | $239.19 | $687,678 | 27.49% | $593,335 | 10.00% |
| 2013 | $187.62 | $539,396 | 0.00% | $539,396 | 0.00% |
| 2012 | $187.62 | $539,396 | $539,396 |
2023 Harris County Appraisal District Tax Value
| Market Land Value: | $687,500 |
| Market Improvement Value: | $302,814 |
| Total Market Value: | $990,314 |
2023 Tax Rates
| HOUSTON ISD: | 1.0372 % |
| HARRIS COUNTY: | 0.3437 % |
| HC FLOOD CONTROL DIST: | 0.0306 % |
| PORT OF HOUSTON AUTHORITY: | 0.0080 % |
| HC HOSPITAL DIST: | 0.1483 % |
| HC DEPARTMENT OF EDUCATION: | 0.0049 % |
| HOUSTON COMMUNITY COLLEGE: | 0.0956 % |
| HOUSTON CITY OF: | 0.5336 % |
| Total Tax Rate: | 2.2019 % |
Estimated Mortgage/Tax
minimize| Estimated Monthly Principal & Interest (Based on the calculation below) | $ 4,469 |
| Estimated Monthly Property Tax (Based on Tax Assessment 2023) | $ 1,682 |
| Home Owners Insurance | Get a Quote |
Subdivision Facts
minimize2023 Subdivision Facts
Schools
minimizeSchool information is computer generated and may not be accurate or current. Buyer must independently verify and confirm enrollment. Please contact the school district to determine the schools to which this property is zoned.
ASSIGNED SCHOOLS
View Nearby Schools ↓
Property Map
minimize2028 Sul Ross St Houston TX 77098 was recently sold. It is a 0.14 Acre(s) Lot, 2,875 SQFT, 3 Beds, 2 Full Bath(s) & 1 Half Bath(s) in Dearborn Place.
View all homes on Sul Ross

items